

What Is a Bell Curve? (Simple Explanation)
A bell curve (also called a normal distribution or Gaussian distribution) is a symmetrical, bell-shaped graph where most values cluster around the middle, with fewer values at the extremes. In statistics, it means: most outcomes are average, a small percentage are excellent, and a small percentage are poor. See how Confirm handles performance management.
In performance management, a bell curve performance review (or forced distribution) requires managers to rank employees as if their performance naturally fits this shape — typically forcing 10–20% into a top tier, 70% into a middle tier, and 10–20% into a bottom tier, regardless of actual performance.
The problem: research shows that talent doesn't follow a bell curve. It follows a power law distribution — where a small number of top performers generate disproportionately large results. Forcing a bell curve creates artificial rankings that misrepresent actual performance.
How Does a Bell Curve Work in Performance Management?
A bell curve (also called a forced distribution or normal distribution) works by requiring managers to rate a fixed percentage of employees in each performance category. Typically: 10% top performers, 80% middle performers, and 10% low performers. In theory, this forces managers to differentiate performance rather than giving everyone a "meets expectations" rating. In practice, it creates arbitrary cutoffs: a team of genuine top performers must still designate 10% as poor. This is how a bell curve works — and why it distorts reality.
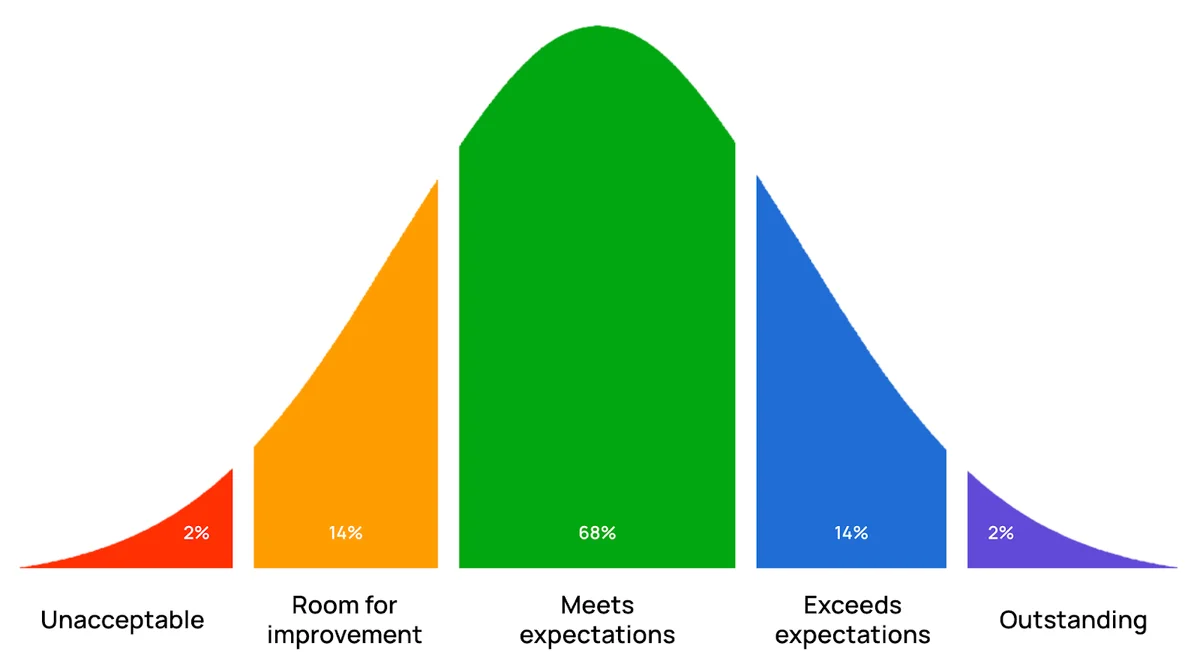
When companies run performance reviews, they produce a bell curve of manager ratings.
This bell curve, known as a “normal distribution”, shows most employees as average, or “Meeting expectations.” A smaller number of employees fall to the left or right. They may get a “Needs Improvement” rating, making them candidates to be exited from the company. Others may be “Exceeding expectations.” They’re more likely to get promotions and rewards.
Bell curves are what you get when you measure additive variables. These are variables that don’t affect one another, like height, or IQ. In the early days of performance reviews, a bell curve made a lot of sense. Work was solitary and repetitive.

But today’s work is different. It happens in networks, using tools like Slack, Teams, and Zoom. It’s collaborative and creative. Does a bell curve still make sense?
Talent follows a power law (And Why 9-Box Grids Capture It Better)
There’s a secret about talent management that HR doesn’t understand, but academic researchers do: talent follows a power law.
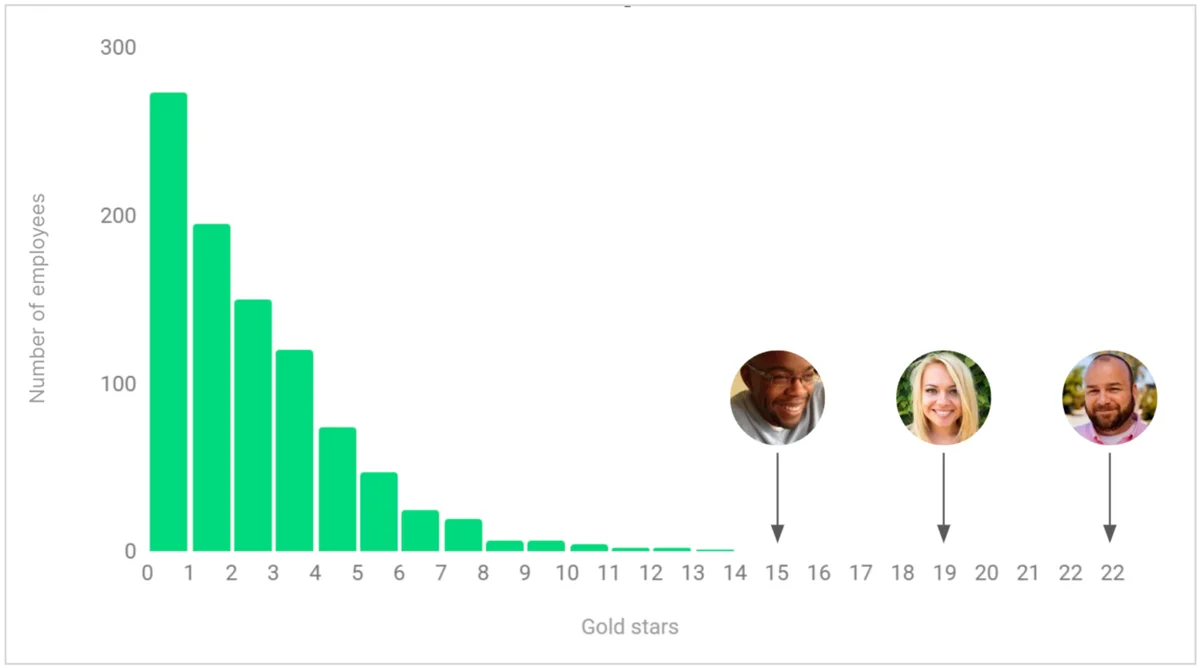
Why is this? Because work today isn’t solitary or repetitive, it’s creative and team-driven. There’s a lot of variability in how employees plan a marketing campaign or design a new software feature.
That means we’re not measuring additive variables anymore, but multiplicative ones. That’s why we have “10X” software engineers. Or account executives who 3X their quotas and find time to lift the rest of the team up too.
You can test this for yourself. Think of 8-10 people who you work with. My bet is that there are one or two of them who are so amazing, you wish you could clone them. That’s the power law of talent.
We’ve been thinking about talent the wrong way
Manager-driven performance reviews aren’t built for this new world of work. One reason is that 10X employees create a lot of their value by helping the people around them. Managers often lack the visibility to see this.
But here’s the bigger problem: the bell curve measures manager ratings, not actual performance.
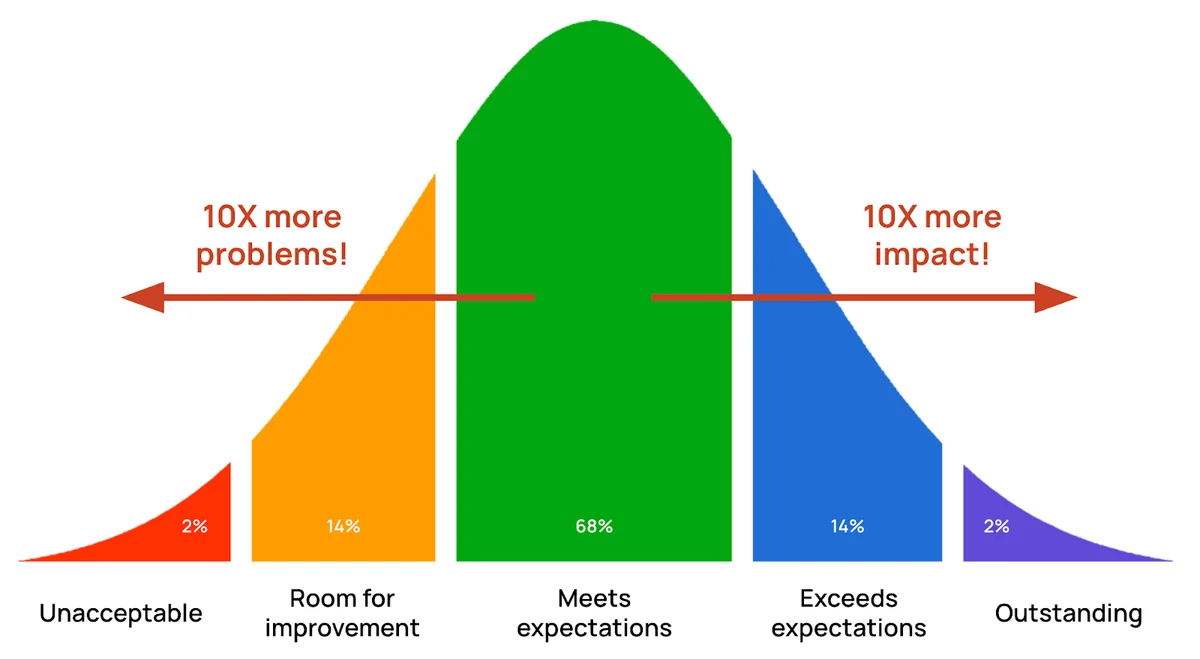
By squashing the power law into a bell curve, we hide the true impact that top and bottom performers make. And we make many of our talent decisions with this misconception at the core.
That includes compensation, which under-rewards top performers and over-rewards bottom performers. Interestingly, in jobs where performance is both measured and transparent, compensation tends to follow a power law. That’s why a superstar like Stephen Curry makes approximately $59.6 million in the 2025-26 season (Basketball Reference, 2026), compared to the median NBA player who makes around $2 million.
- O'Boyle & Aguinis (2012), HBR: Analysis of 633,263 performers across entertainment, sports, politics, and academia found elite performers do NOT fit a bell curve — they follow a power law, with the top 5% producing 26% of total output.
- McKinsey Global Survey: Top performers in data-intensive jobs produce 800% more than average performers. In complex roles, the gap is even larger.
- Microsoft, GE, Accenture, Adobe: All abandoned forced-ranking/bell curve systems between 2013–2016, citing negative effects on collaboration, retention, and innovation.
What Is a Bell Curve?
A bell curve (also called a normal distribution or forced distribution) in performance management is a rating system that distributes employee performance scores across a predetermined curve — typically with most employees rated "average" and a fixed percentage at the top and bottom. Organizations use bell curve performance appraisals to force-rank employees and standardize ratings across teams.
Why Bell Curve Performance Reviews Fail: 5 Key Reasons
- Talent doesn't follow a bell curve: Research shows top performers produce 400–500% more than average in complex roles, following a power law, not a normal distribution.
- Forces artificial rankings: Managers must designate 10% as low performers even on high-performing teams, creating resentment and reducing collaboration.
- Destroys trust and morale: Employees ranked near the bottom due to quota, not performance, disengage and quit.
- Creates perverse incentives: Peer competition replaces cooperation when individual rankings determine compensation and job security.
- Ratings reflect manager bias: The idiosyncratic rater effect means up to 62% of rating variance reflects the manager, not the employee.
Why Bell Curve Performance Reviews Fail: 5 Key Reasons
- Talent doesn't follow a bell curve — Research shows top performers produce 400–500% more than average in complex roles, following a power law, not a normal distribution.
- Forces artificial rankings — Managers must designate 10% as low performers even on high-performing teams, creating resentment and reducing collaboration.
- Destroys trust and morale — Employees ranked near the bottom due to quota, not performance, disengage and quit.
- Creates perverse incentives — Peer competition replaces cooperation when individual rankings determine compensation and job security.
- Ratings reflect manager bias — The idiosyncratic rater effect means up to 62% of a rating variance reflects the manager, not the employee.
How to Replace Bell Curves with Power Law Distribution in Your Organization
Understanding the problem is one thing. But how do you actually move away from bell curves and implement a performance management system that reflects power law distributions?
Step 1: Stop Forcing a Distribution
The first step is to acknowledge that your organization doesn't need—and probably doesn't want—a forced distribution. If your true data shows that 25% of your team are exceptional performers, that's okay. A forced distribution prevents you from seeing and rewarding this reality. Instead of using bell curves, let performance data tell its own story.
Step 2: Use Multiple Data Sources
Manager ratings alone won't reveal power law distributions. You need multiple perspectives: peer feedback, objective metrics, project outcomes, and network analysis. When employees collaborate across teams, their impact becomes visible through organizational network analysis (ONA). This shows who the connectors and amplifiers are—the people who make others more effective. These are often your power law performers.
Step 3: Run Proper Calibration Sessions
Calibration sessions should focus on consistency and fairness, not on fitting a predetermined curve. Bring managers together to discuss their ratings, compare notes on what "exceeding expectations" means in practice, and ensure accountability. The goal is to reduce bias and hidden assumptions, not to force a mathematical distribution.
Step 4: Reward Top Performers Like Superstars
Once you see your power law distribution, act on it. Your top 10-25% of performers drive disproportionate value. Compensation, promotions, flexibility, and opportunities should reflect this. You can't keep top talent if you compress their rewards to fit a bell curve. Use clear performance review conversations and language to communicate how top performers are valued. Treat your 10X employees like the superstars they are.
Step 5: Address Low Performers Directly (or Refer to Performance Improvement Plans)
A power law distribution often shows a clearer picture of bottom performers too. Rather than creating a "needs improvement" category to fill a curve quota, use this data to have real conversations. Some people need development; others may not be the right fit. Either way, you're making decisions based on data, not on how many slots you allocated to the bottom tier.
The companies winning the talent game have already made this shift. They're not constrained by bell curves. They see their talent for what it really is—a power law—and they're building compensation, promotion, and development strategies around that reality. It's not just fairer; it's more effective.
Maybe it’s time to start treating our 10X employees like the superstars that they are.
Ready to move beyond bell curves? See how Confirm's performance management approach helps you identify and develop talent based on actual performance patterns, not forced distributions.
Bell Curve Performance Review: The Problems in Practice
A bell curve performance review (also called forced distribution or stack ranking) requires managers to distribute employee ratings along a normal distribution — typically with a set percentage at each level: top 10%, middle 70%, bottom 20%.
In theory, this prevents grade inflation. In practice, it creates three systemic problems:
1. Forced losers in high-performing teams. When a team of 10 exceptional performers must rank someone in the bottom 20%, you've manufactured a loser. That person may be excellent — just not the best in an unusually strong cohort. The system punishes concentration of talent.
2. Manager gaming and relationship bias. When managers know someone must finish at the bottom, they protect their favorites. The rating stops reflecting performance and starts reflecting relationship quality.
3. Collaboration collapse. Research from Microsoft's stack ranking era documented how teammates began withholding information from each other to stay competitive. A system designed to drive performance ended up destroying it by creating zero-sum competition.
High-performing organizations have largely abandoned forced distributions in favor of calibrated ratings — where managers align on what "exceeds expectations" means, then apply that standard consistently without artificial quotas. See performance calibration and how to run calibration for the alternative model that actually works.
Looking to improve your review process? See our guide to self-evaluation sample answers and manager feedback examples that help teams give and receive better feedback without forced rankings.
Want to see how Confirm handles this? Request a demo — we'll walk you through the platform in 30 minutes.